
Scroll down. Look at the brown bars in the last graph. Read all the yellow bits. That's it.
New South Wales provide details of health outcomes from the Omicron wave of coronavirus.
These numbers are helpful for people trying to make decisions about many aspects of everyday life, and are collected here to make them more available.
The key factors are: age of the person at risk and vaccination status, of course. Other factors are the status of vulnerable people in your family group.
First, to help with these decisions, a recent NSW Health data table about the hospitalisation outcomes in NSW during the large Omicron wave:
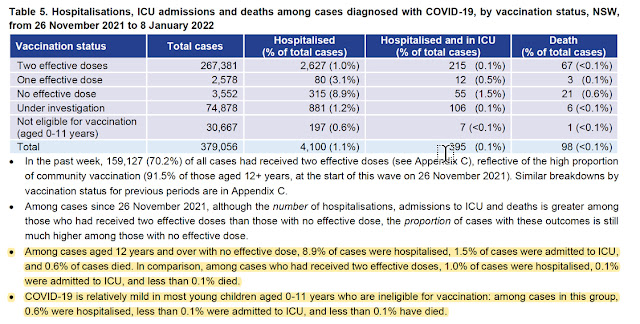
Yes, it is a complicated table, but the important aspects are spelt out in the yellow highlights.
People who are unvaccinated are about 10-fold more likely to have bad disease outcome if they get infected than those who have at least 2 doses of a vaccine. Fortunately there is high vaccine uptake in most areas of Australia.
But there is more, helpful information from NSW Health on Omicron COVID variant health risks:
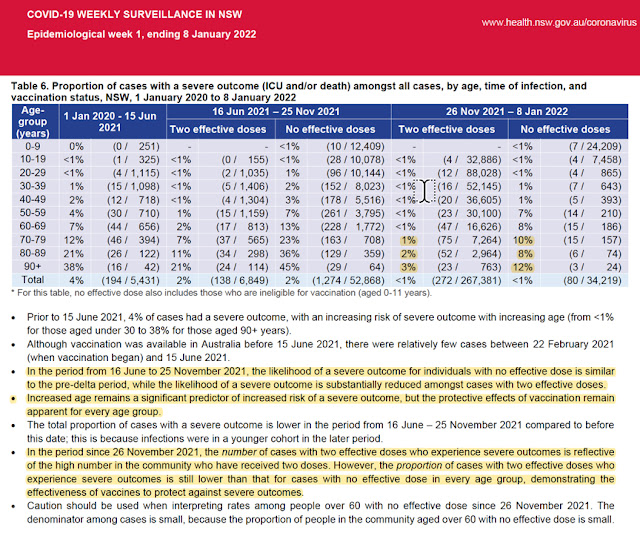
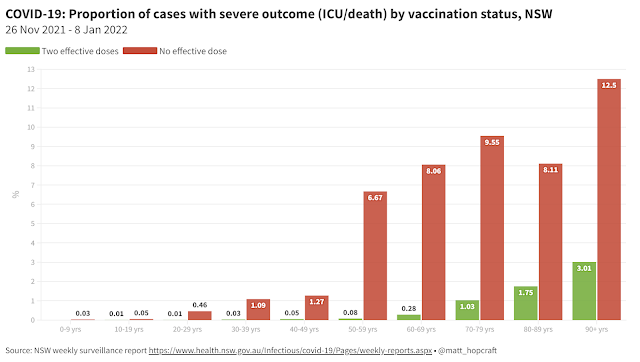
In all age-groups, green bars are substantially lower than the bown (unvaccinated) bars. Most of the bar total area (the risk of severe disease) is brown, and for 50 plus age-groups.
Yes that's it. Worry most about the over-50s, and how to protect them.
Reduce further transmission of infection. And get vaccinated and boosted.
No comments:
Post a Comment