Updated 4th, 10, and 11th February 202
Key numbers for Victoria
- Omicron wave deaths per infection at 13 per thousand infections are 5-fold lower than during previous Delta wave.
- Peak daily deaths with Omicron 3-fold greater than Delta wave.
First, the initial 28 January 2022 posting, then the later, February updates.
A long lag between death and initial infection can lead us to misinterpret Omicron variant "mildness".
28 January. So far, many infections caused by the Omicron variant have occurred during the latest wave of COVID-19 disease in Australia . Many aspects of these events have suggested that the outbreaks have, relatively speaking, caused moderate amounts of harm.
This pattern of thinking glosses over a lot of pain, and sincere apologies for that.
But there is a need to discuss and analytically interpret what is happening and understand what its immediate implications are.
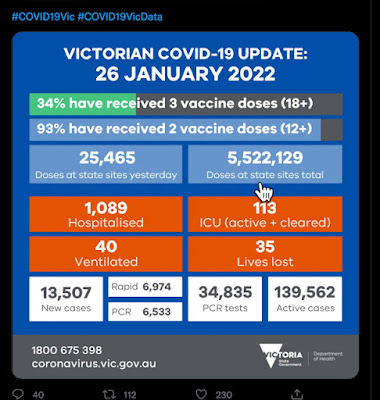
What happened today is that the Victorian state health authorities announced that 35 people sadly lost their lives to COVID-19.
To some, this may seem like just another day of deaths due to the coronavirus epidemic.
But to the Pundit, this is the most shocking news in the latest wave of the epidemic.
It confirms the Pundit's worst suspicions. That the relatively low mortality rates seen so far with Omicron variant infection are a lull before a storm.
The context is a careful argument shared in a recent blog post by David Glassman, that deaths from the Omicron SARS-2 virus in South Africa lagged unusually long after the onset of disease. By a lag of some 10 to 12 more days than with earlier waves.
Implications of a long lag from infection to death for Australia
Here is a diagram that puts this in context for Melbourne and Victoria.
This graph plots daily new infections and daily deaths for the Australian state of Victoria.
Daily new infections are scaled so that peaks for deaths and cases in the previous delta wave are the same height. This scaling of the size of case number peaks shows that during the early stages of the December-January Omicron epidemic wave, deaths are "uncoupled" from case numbers.
The seemingly small rise in deaths might suggest that the death rate with Omicron is much, much, lower than from infections during the Delta variant wave in September-October.
But if we think carefully about the extended period of time needed to die after infection, we realise that current deaths correspond to infections that occurred long before the peak of daily Omicron wave infections.
Relatively simple arithmetic from the graph, based on the rule that deaths are proportional to the number of people who get infected, predicts that peak daily deaths from Omicron variant infection will be ~ 35x150/80= ~65 lives lost a day.
Several hundreds of people will die over the next weeks.
The Pundit finds this deeply shocking.
It is based on existing large numbers of known infections and the indication from the graph that daily deaths are continuing to rise. This is fully expected if deaths lag onset of disease by about 23 days, as revealed by David Glassman.
Both those assumptions can, and should be checked. For instance, questions about time taken for patients to die should be posed at press conferences and Twitter feeds.
Update 11 Feb 2022
Disturbing daily death rate projections of 28th January were partly confirmed by unfolding daily health reports. But finally we passed peak daily deaths around 9th February 2022 and a mortality lag of near 20 days was obvious.
The death time lag concerns were confirmed by unfolding events in Victoria:
By the 4th of February there was a rise in daily deaths counts from SARS-2 infections, and by 11 February 2022 this was how events had progressed :
Assuming that peak daily mortality has been reached by 26 January, the pattern of deaths and cases are consistent with about a 20 day lag between symptom onset and loss of life, as observed for the Omicron epidemic wave in South Africa by David Glassman.
Using peak values for daily cases (22,400 for the interval 6 Jan to 20 Jan) and daily lives lost (28.9 for the interval 26 Jan to 5 February), the overall mortality rate in the Omicron variant wave is close to 13 deaths per 10,000 infections, as compared to 59 per 10,000 infections in the preceding Delta variant wave. Peak daily deaths were less that the alarming value of 65 lives lost per day mooted at the top of this post on 26 January.
Peak daily deaths counts per day were however about 3-fold higher with the Omicron variant outbreak compared to the previous Delta wave because of extremely high numbers of people who were infected with the Omicron variant.
11 Feb 22. Full Epidemic curve H/T COVID BASE AU
Finally, the overall picture of cases , hospital occupancy and daily deaths confirms that we have passed the peak of the Omicron epidemic wave in Melbourne. That's a bit of cheer after a long period of uncertainty and rising risks..


No comments:
Post a Comment