
Updated 25 January 2022
Huge numbers of infections have been a serious worry in Melbourne Australia since the Omicron variant epidemic wave burst into activity late December 2021. High patient numbers are challenge for the hospital system.
Amid this crisis some encouraging epidemic news has been understandably largely side-lined.
Death rates (lives lost per 100 infections) have dropped.
Perhaps the reason is that interpretation of these matters is tricky. It is bitter-sweet news and it's easy to underestimate these rates. One reason is that deaths lag the onset of illness, and in a rapidly expanding outbreak this lag has to be accounted for.
Pundit thinks it is best to get this news out even if it is unpalatable.
Lower mortality rates in the Omicron wave.
In the absence of detailed patient records, here is one approach to finding out what's happening.
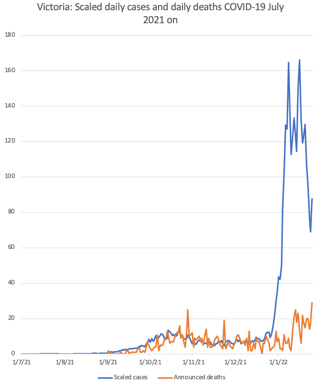
First the time course of cases and deaths are as follows
 |
In this graph, daily case numbers in blue have been scaled by multiplying by 0.59/100 to align with the numbers of lives lost per day |
In the New Year, infection numbers took off like a rocket -- and this take off is largely Omicron virus variant.
But daily lives lost are, thankfully, not so much of a surge. But there was a lag before they indeed did rise too in mid-January 2022, in marked contrast to the pattern of the Delta wave
The make more sense of these we need to look at cumulative numbers.
Here they are for infections numbers against date of announcement
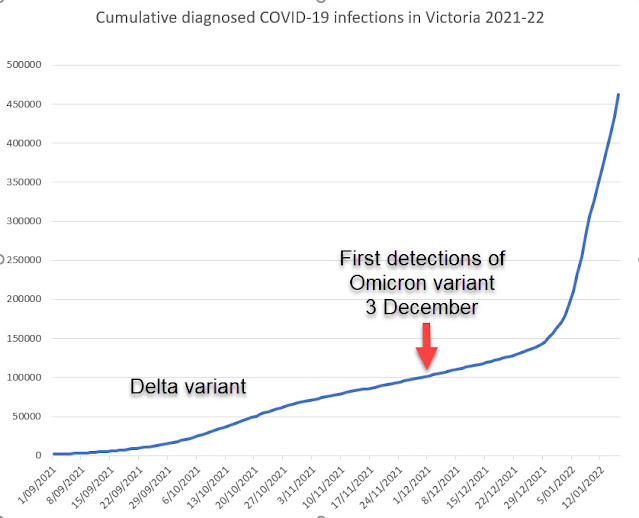
These first wave in this period amounted to some 100,000 cases and was caused by the Delta variant of coronavirus. Omicron variant was detected when there were about 100,000 cumulative cases but there was a lag before it dramatically influenced case number counts. Bear this profile in mind when considering the next graph.
Deaths plotted against cases enables visualisation of the severity of mortality.
The graph below plots the cumulative number of deaths versus the cumulative number of infections 11 days earlier, when on average these people would have first suffered symptoms and been identified. (NSW Health Service provide this estimate in their weekly reports on COVID-19.
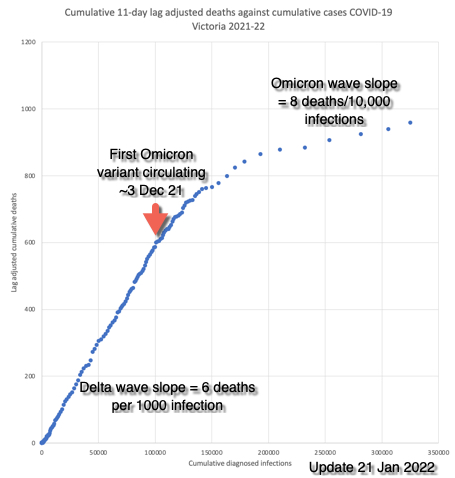
The first part of this graph has a constant slope. This is the time of the Delta wave of the Victorian COVID-19 epidemic.
The constant slope indicate very sadly that 5.9 people died in every 1000 detected infections.
Remarkable the slope changed about the time in the epidemic that Omicron variant started to circulate, and by 21st January was equal to 8 deaths per 10,000 cases. This is a major reduction in epidemic severity compared to the Delta wave. For vaccinated people the mortality rate would be lower still, as deaths are known to be predominant older unvaccinated people.
This softens the blow of the epidemic a bit, and we should scrutinise this preliminary look very carefully the next week for hopeful news.
We thus from the slope of the graph, can expect at the moment about 1 or fewer deaths per 1000 Omicron variant infections.
The Lag is a killer.
But further rises in deaths will surely come. We already know the daily case numbers that will produce those deaths. They are in the range of 20,000 to 28,000 new infections a day. From the arguments here, daily deaths are thus likely to average near 15 to 25 lives a day over the next two weeks.
But if daily infections moderate the next few day, there will be respite from lives lost around the start of February. That's the reality of an 11-day lag.
Afternotes.
Time lags to death may be much longer in Omicron variant
23 January. An excellent blog item by David Glassman raises the likelihood that infection the Omicron variant leading to death may exhibit a much longer lag after infection before death occurs than with earlier variants.
The lag of 11 day used above may be grossly wrong and thus yield an underestimate of mortality displayed by Omicron infection .
Shortly the Pundit will update this post with estimates based on a longer lag between infection and death.
25 January
Updated time series
The latest death announcement 25 January has serious implications. It may portend further several-fold rises in daily deaths and confirm that David Glassman's estimates of the delay between illness onset and death in the South Africa Omicron wave are valid for Australia.
This is grim news. It implies an extended period of higher daily deaths in Victoria.
(25 Jan 22 Error in David Glassman's name corrected. Apologies David)
No comments:
Post a Comment